Introduction
Imagine you’re a researcher interested in international security. You want to explore how countries across the globe differ on questions of technology adoption. You are in luck! You find that a new dataset on global technology purchases was published this year. You jump into the data and—hang on, why are domestic_ict_firms and domestic_network_providers different variables? What is the difference between the two? How is the perceived_innovation index weighted? And where did this data come from, anyway? When was this updated? Who can I ask for clarification?
A good codebook should give you these answers quickly and easily. Project Evergreen found that reality can be significantly more complicated. We combed through codebooks, methodology essays, and other forms of research documentation for a wide variety of global datasets. We found an incredible variety of formats, uneven levels of explanation, weird update schedules and hard-to-find sources that make interpreting a dataset frustrating and confusing.

Project Evergreen is an initiative of the Global Disinformation Lab at the University of Texas. Our goal is to develop a database of global policy responses to disinformation and misinformation. We want to enable researchers doing important work in this area and connect students with resources to understand policy responses to information disorder. Future researchers should be able to access, interpret, and build on our work easily and without hours of head-scratching. We set out to understand how social science researchers- especially “comparativists”- approach documentation. What role do codebooks play? What are the best practices?
We’ve distilled what we learned from our review into three sections: the essentials, the mundane requirements of accessible codebooks, and a common mistake to avoid. Documentation strategy often falls into the “hidden curriculum” of research design. So we are writing this post to share what we learned and highlight resources for learning more.
What is Project Evergreen?
Learn more and browse our project wiki
Learning from Others: Our Approach
Our project we will be dealing with policies enacted across the world related to misinformation and disinformation. So it was important for us to focus on datasets of a global scale, featuring data that either aggregates policy or directly informs policy. We examined 13 projects that produced data on a range of topics. For example, we reviewed the Global Health Expenditure Database, Climate Change Laws of the World, and the WORLD Policy Center database. As we read the codebooks and methodology documents we recorded information about them in a collaborative spreadsheet. We chose many of our column headers based on features we are considering for our own codebook.
Example column headers included:
- Introductory Essay (Y/N)
- Version Number
- Data Limitations Addressed (1-5)
- Data Collection Strategy Explained (1-5)
- Scope Justification (1-5)
- FAQ (Y/N)
- Update Schedule (Y/N)
- General Notes
After collecting information across codebooks, we were able to quickly identify differences in data documentation. For example, the majority of codebooks we looked at didn’t contain an FAQ section and half didn’t include information about the data’s update schedule.
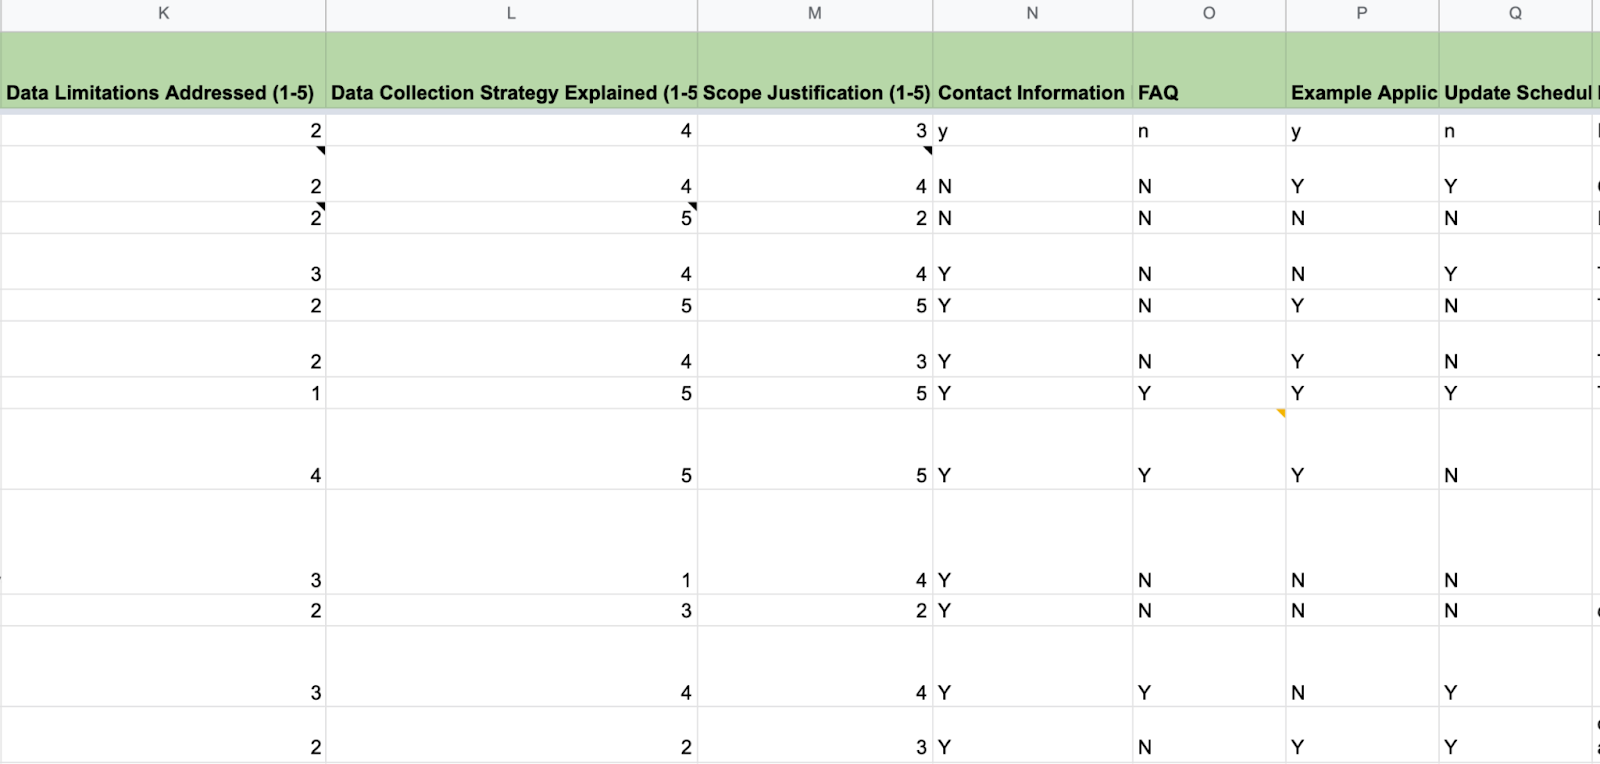
Scoring various features of these documents led us to discover a surprising weakness in many of the codebooks. Under the column “Data Limitations Addressed”, the majority of projects scored between 1 and 3. Communicating the limitations of a dataset facilitates good research practices and ensures the data is being interpreted correctly. Systematically comparing the documentation allowed us to consider what features add up to an effective codebook or methodology page.
We summarize our impressions below, but if you end up looking through codebooks related to a research topic you are interested in, consider developing a list of questions to ask yourself as you read. Knowing what you are “looking for” ahead of time can help you stay focused and receptive to ideas for your own project. Some suggestions are listed below:
- How can I write a codebook that communicates in a way accessible for subject experts and also the general public that may also utilize this database?
- How should I organize my codebook?
- How can I minimize redundancy while not compromising clarity?
If you develop your focus beforehand your time will be spent more effectively and reading those codebooks (especially the 200+ page ones…) won’t be as overwhelming.
What we learned from reading 842 pages of social science research documentation
So—how do you go about preparing a codebook that is functional, accessible, and useful? Our analysis revealed three key areas of learning: research documentation basics, accessibility and researcher experience, and managing limitations.
Research Documentation Basics
- Explain your variables: Your reader needs to understand what things mean if they’re going to make meaningful conclusions or use a dataset for analysis. Not explaining your variables can lead to confusion in their understanding of the results and inaccurate analysis or application of your data. Not a good look for researchers. Give examples that help clarify distinctions between variables. Visualize how codes relate to one another. Do whatever it takes to make yourself understood.
- Explain the timeline for data updates: Your reader needs to understand when the data was last updated, and what was changed. Has this data been sitting untouched for ten years? Has it been updated lately? What has changed? Did the update completely overhaul a variable? Cosmetic fix to the website? A typo? This is important because updated data can change the strength of results or reveal different trends. If you’re applying data, updates may change the scope or applicability of it to a certain field.
- Justify your scope: Justifying the scope you used to collect data legitimizes your project and conveys the background thinking/research that went into its formation. Understanding the scope allows better understanding of the data as a whole and its purpose. Furthermore, it makes clear where the data can be applied. This practice has the added benefit of helping you better understand your own project!
- Apply your data: Many individuals who read your data are looking to either analyze it or apply it to something they’re researching. Providing examples in your codebook of how your data can be applied gives the reader a sense of where/how it is best applied and where it would be inappropriate to apply. It can also add significant value to your data. Sometimes understanding where data fits in and what it represents invites application to broader trends or theories.
Accessibility and Researcher Experience
- Provide contact information: Contact information allows further discussion and explanation of your data and research. This is very helpful to readers looking to use your data for further research, especially if they have detailed questions
- Include FAQ: This is good practice to make sure any common questions or misunderstandings of your data are addressed. If your data has some basic background information or more complex components to it, a FAQ can make it much more understandable to the reader or non-experts in the field
Managing Limitations
So far, we’ve focused on how to produce codebooks that produce clarity for the research team and empower future researchers. There is one other consideration that can elevate a codebook: addressing data limitations. Perhaps the most surprising takeaway from our analysis was how common it is to skip this section or only address it in passing.
Understanding data limitations is crucial. The best research projects understand the strengths and limitations of the data. Data limitations can affect research design decisions, how writers characterize findings, and even policymaking. Here are some questions to ask yourself when thinking about how to communicate data limitations:
- Do my data sources limit any applications in terms of quality/legitimacy?
- Are there regional limitations in my data? Did I have data for every locality?
- Were there any statistical data limitations such as small sample size, lack of reliable data, or confounding variables?
- Is there anything in my data that makes it inappropriate to apply to specific populations or groups of data?
- It’s also worth considering data limitations on the level of the variable. What sources are variables derived from? How reliable are these sources?
- Do the data features rely on expert judgment or researcher judgment? Are there limitations to the intercoder reliability? Are you confident in the validity of your strategy to capture a concept?
All data collection strategies and research designs have weaknesses, and by putting yours out there, you make your audience aware of the real potential of the data. If readers are looking to use your data for further research, explaining your limitations can save them a lot of time. Committing to this practice may make you feel vulnerable, but it is the right thing. Intellectual honesty and humility are always appreciated and being candid about the dataset’s limitations make it easier to work with!
Our Project and Opportunities for Innovation
How will this new perspective on research documentation affect our project? We have a new appreciation for the role of effective documentation and the effort required to produce high quality guidance for future researchers. First and foremost, we will be following our own advice. This means documenting our process from the beginning, prioritizing clarity, and being forthright about data limitations. Our review of research documentation practices helped us establish a shared understanding and shared vocabulary for this dimension of the project. While we wouldn’t say we wake up every morning thinking about codebooks and methodology essays, we did have fun. This process has required us to think critically about how future researchers would use the global disinformation policy database, and that has us eager to get started.
We’ve also identified several opportunities for innovation. So expect future blog posts from us on this subject. We want to explore the lessons social science researchers can learn from open source software documentation. Can we make it 10x easier for people to use the global disinformation policy database than any other policy data source? What would that require? Can we display codebook relationships with interactive visualizations? Should we explore screencasts explaining the data collection process? Teams like ours gather data because we want people to use it. So we are committed to exploring every opportunity to make our dataset accessible to as many people as we can. If you have an idea, drop us a line! [Link TKTK]
Conclusion
We hope you make use of our findings as you begin thinking about how research documentation can best serve you. In the appendix below you will find a collection of resources that go into more detail about many of the topics we highlight above.
Our team’s objective is to provide policymakers and researchers with information about the policies relating to misinformation and disinformation around the world. After reviewing the documentation for similar projects, we’ve agree that it is our responsibility to:
- Ensure our documentation is approachable and informative
- Enhance the experience of “consumers” of our data
- Communicate clearly about the limitations of our data collection strategy
Documentation is an element of research design. Documentation enhances the value of your data and promotes better, more coherent coding schemes.
Did you find this post helpful? Reach out to us and let us know. We’d love to hear from you.
Appendix: Resources for doing documentation right
You may be wondering how to incorporate these lessons in your own research project. As we’ve explained above, it pays to think about documentation as a key element of research design. Writing is more than just a form of communication. Writing is a tool for thinking. When it comes to projects that produce original datasets, research documentation acts as both a tool for enabling future researchers and an instrument for clarifying and strengthening your research design. With that in mind, we came up with two checklists that you can use to make sure you follow best practices.
Before you Begin Data Collection
- Write a simple description of what you imagine the final dataset “looks like”. What questions will researchers be able to answer by using this data?
- Set up a centralized note-taking space for capturing the research team’s observations about the data collection process, data coding, and preliminary analysis.
- Be explicit with the team about expectations around documenting search processes or data sources.
- Consult with a trusted faculty member or experienced researcher and ask them to think about whether your codebook captures the information you need in order for the dataset to do the job you want it to do.
During Data Collection
- Recognize and document patterns or oddities in the data.
- Begin writing a FAQ based on questions you, as researchers, ask of the data
- Regularly spot check incoming data to validate assumptions in the codebook.
- Schedule regular check-ins to make sure everything is being documented
After Data Collection
- Return to this blog post to make sure you include the basics of good research documentation.
- Make an update plan before you publish the dataset (reword this one)
- Red team the documentation. Imagine you are a researcher who wants to use the data in a hypothetical project. Try and imagine you don’t have any background knowledge on how the data set was constructed! Is the documentation sufficient? Better yet, give the hypothetical project to a friend or colleague and ask them if the documentation contains the information they would need to begin.